|
BPHC Health Equity
& Precision Public Health Dashboard 
|
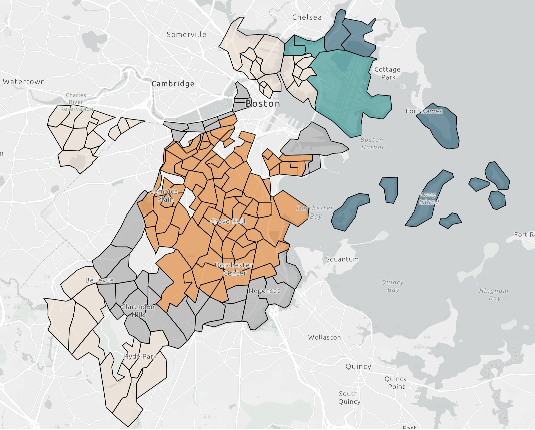
Welcome to the BPHC health equity and precision public health dashboard - explore the relationship between COVID and other diseases using colored maps (choropleths).
Start
Tutorial
|
BPHC Health Equity and Precision Public Health Dashboard
Introduction
The Boston Public Health Commission (BPHC) Health Equity and Precision Public Health Dashboard was developed to help the public, public health professionals, and clinical workers better understand health throughout Boston. It takes public health information from:
- The Center for Disease Control (CDC) - stroke rates, diabetes rates, asthma rates, etc.
- The Environmental Protection Agency (EPA) - particulate matter levels, ozone levels, etc.
- COVID-19 data from Johns Hopkins University - COVID-19 case and death rates
The Dashboard
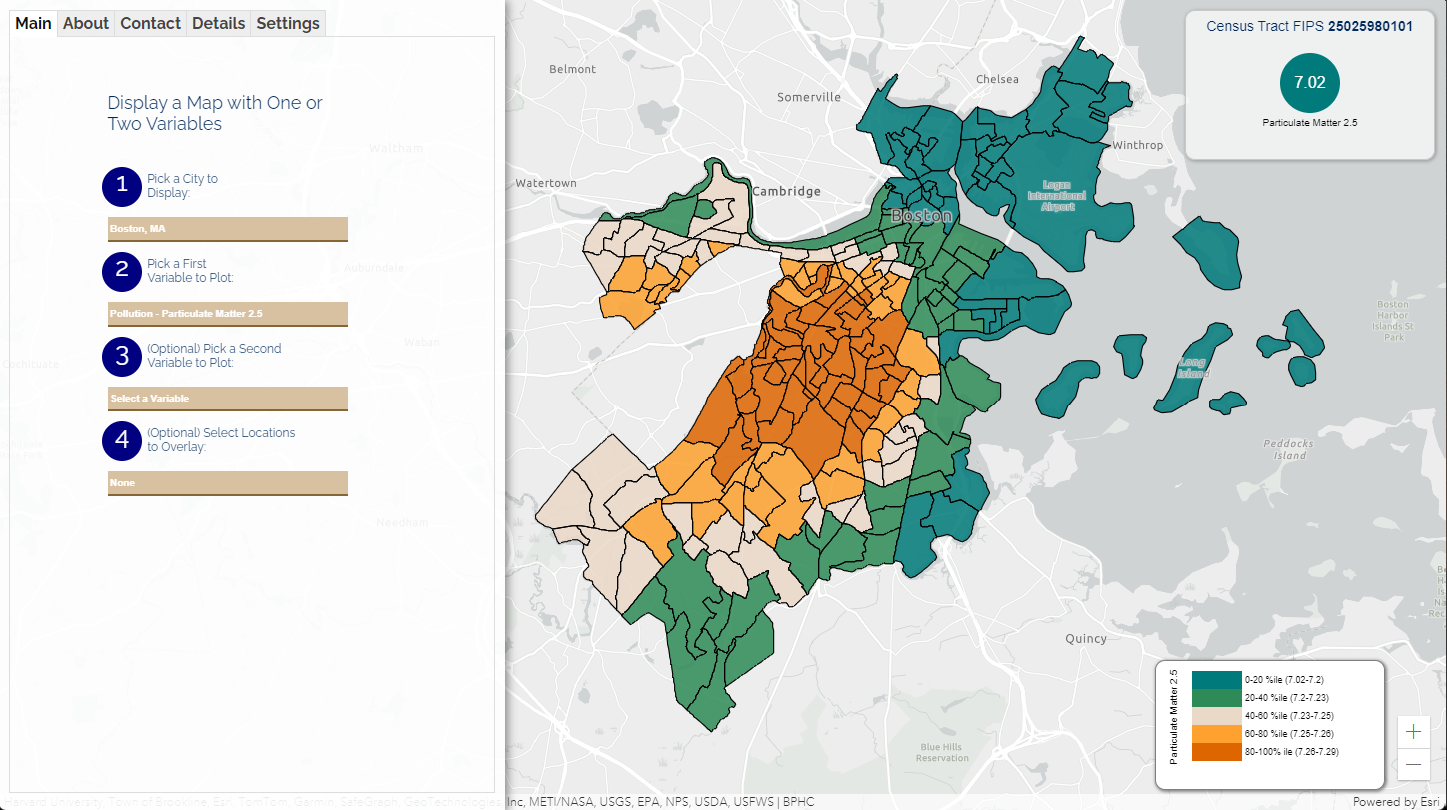
To use the dashboard, you can select what you would like to plot in a map on the left, and then create a colored map (choropleth) using one measure (such as asthma, COVID-19, or ozone) or two measures together. You can create a map using the following steps:
- 1. Pick a city - you can select Boston, New York, or other cities
- 2. Select the first measure - this is what you'd like to appear on a map (this will create a colored map with one variable, or a "univariate choropleth").
- 3. Select Another Measure - select a second measurement for creating a map. This will automatically create a bivariate choropleth (two colored map).
- 4. Select Locations to Overlay - you can select public, private, and other schools.
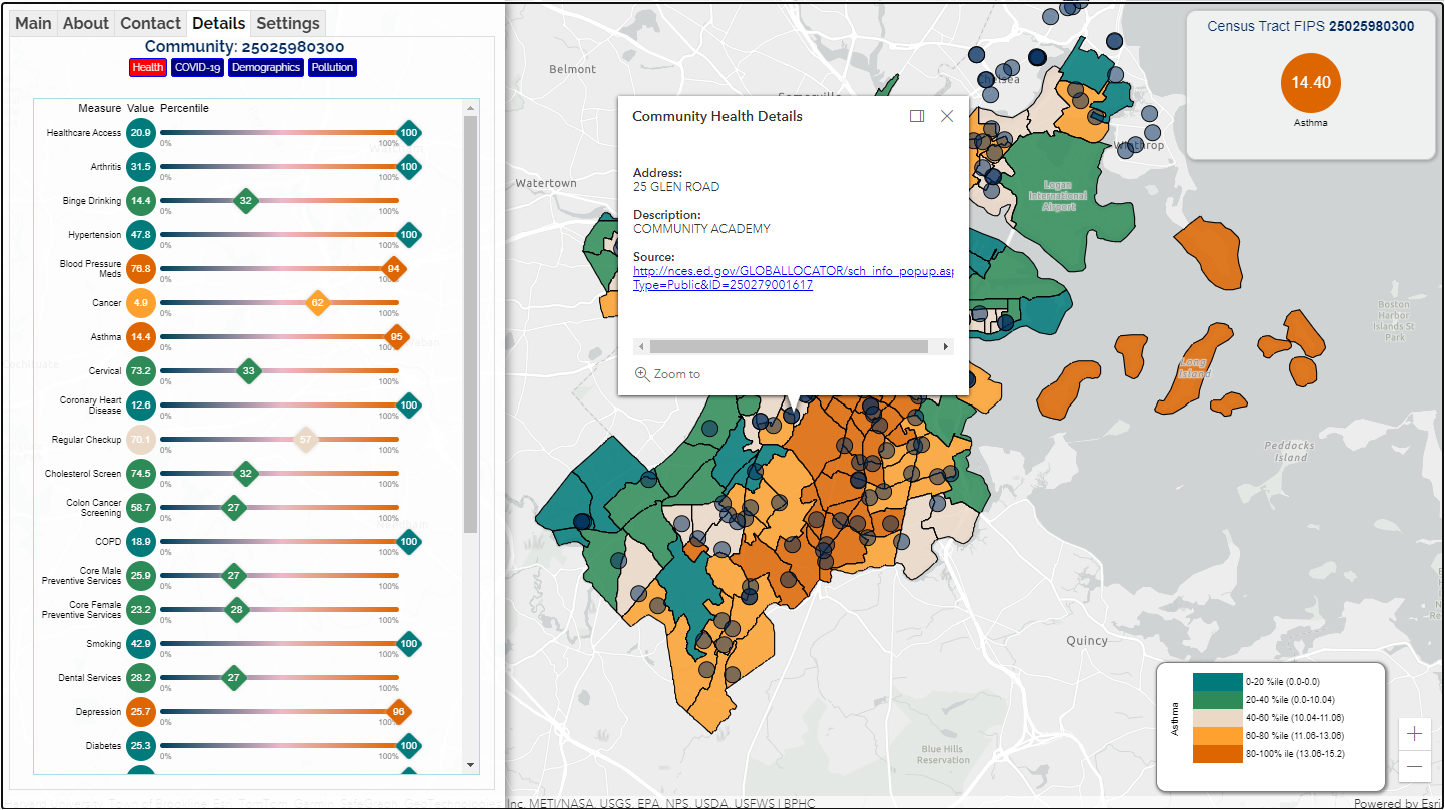
Once you have created a map, you can then click on a region in the map (you will see census tracts displayed, with a 12-digit FIPS identifier), and it will display various disease rates (as a percentage), demographics (also percentages), and normalized pollution rates and measures from the EPA on the right side of the screen. Three columns are displayed:
- the "Measure" name (such as asthma or cancer)
- the "Value" (such as a percentage or count)
- the "Percentile" is displayed in a gauge graph (where the percentile is calculated relative to the number of census tracts and distribution of values in those census tracts for a selected city). Clicking on a location will also show a small popup window, with a link to more information for that location.
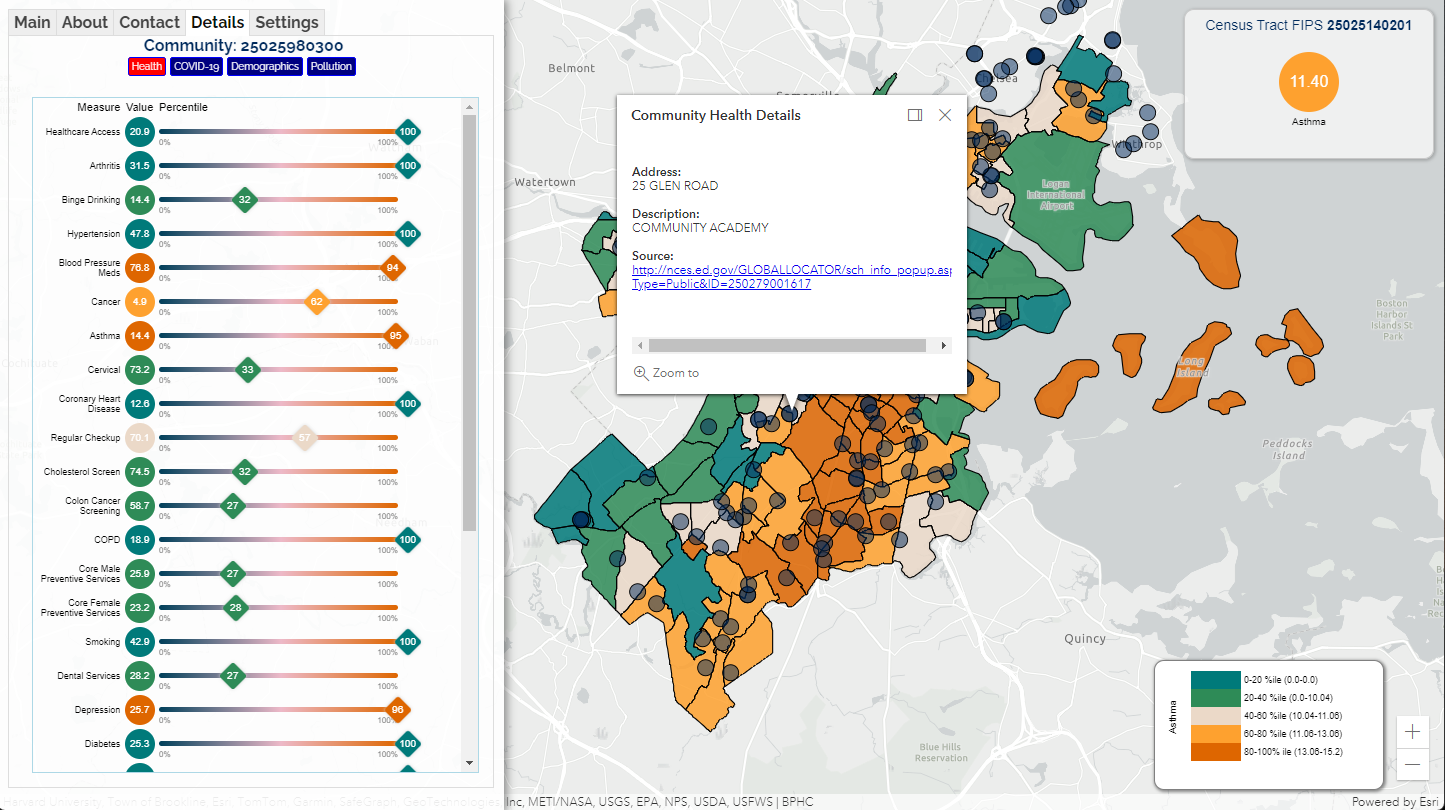
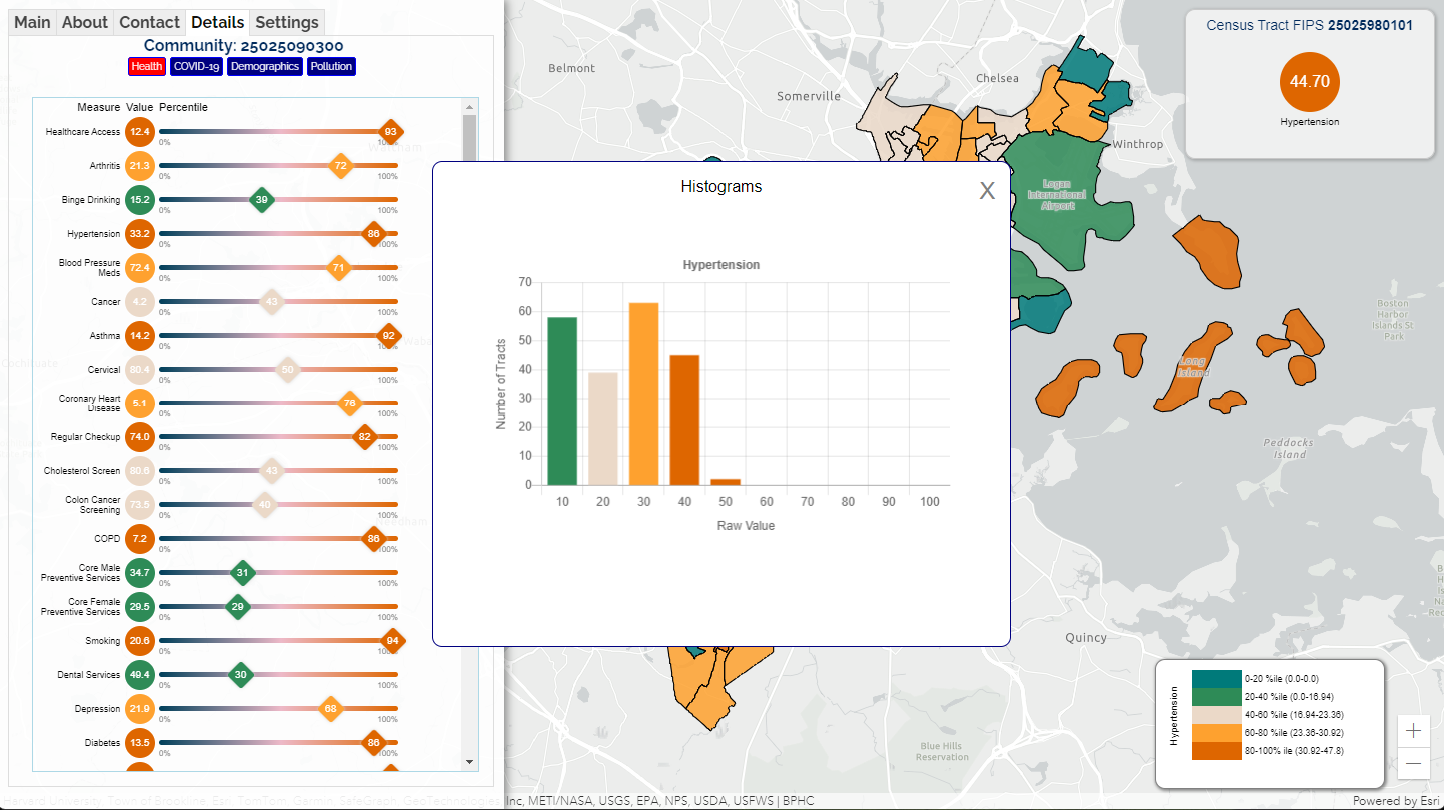
As you move your mouse, the panel in the top right will update with information for the selected information field (ex. "Asthma" percentages will be showed in the top right). Clicking on this value in the top right will display a histogram of a particular value or values selected, with the histogram bars color-coded according to the legend:
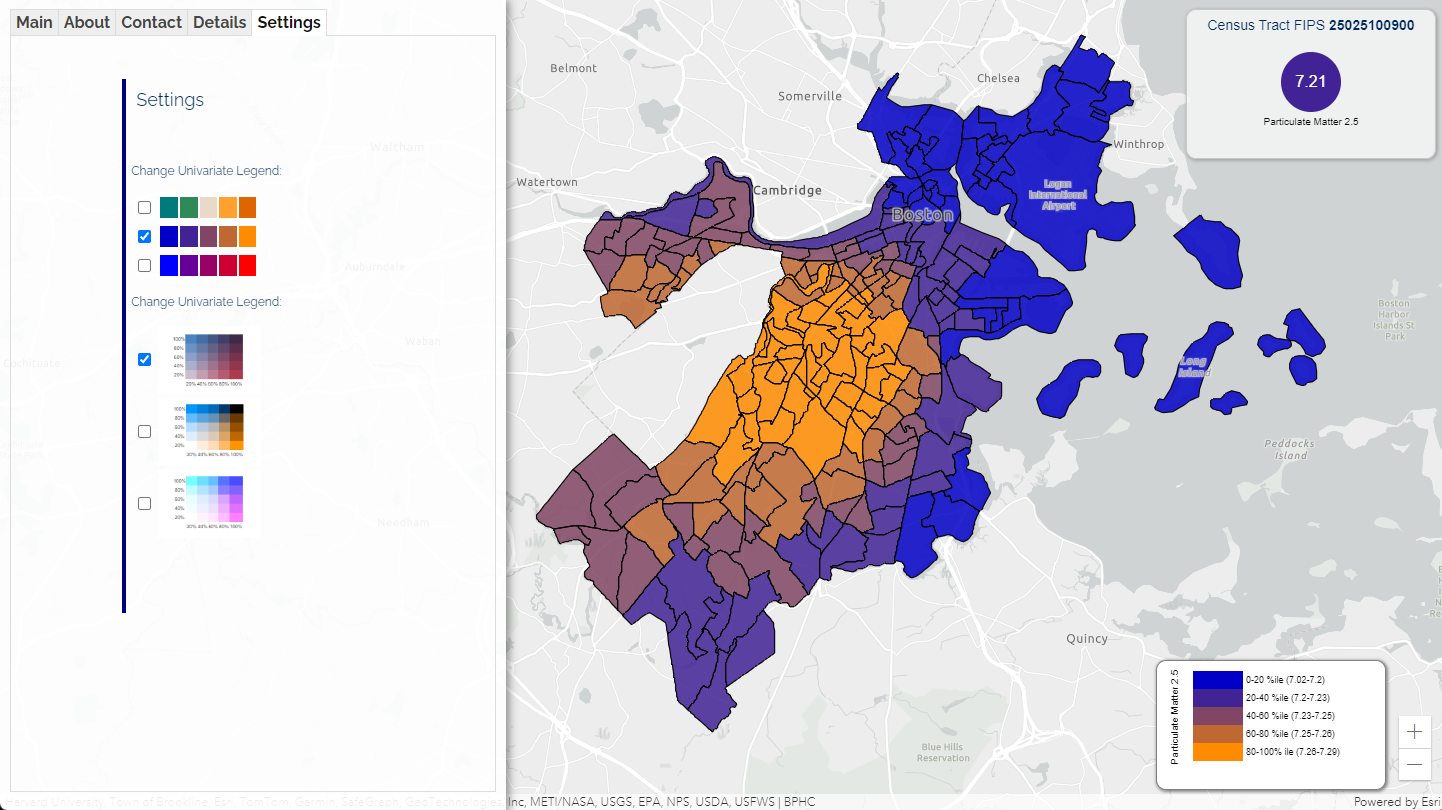
Under the Settings tab on the left side of the screen, the color scales used for single variable (univariate choropleths) or two-variable maps (bivariate choropleths) can be changed:
Example Use Case: Asthma
Viewing the distribution of asthma rates across a city like Boston, and the relationship of those rates to public schools can be performed as follows:
- 1. Pick a city - select "Boston, MA" from the first list on the left side of the screen.
- 2. Select the asthma measure - select the "Health - Asthma" disease from the second list. This will automatically create a colored map.
- 3. Select locations to overlay with asthma - in list 4, click on "Public Schools" to overlay the locations on the map.
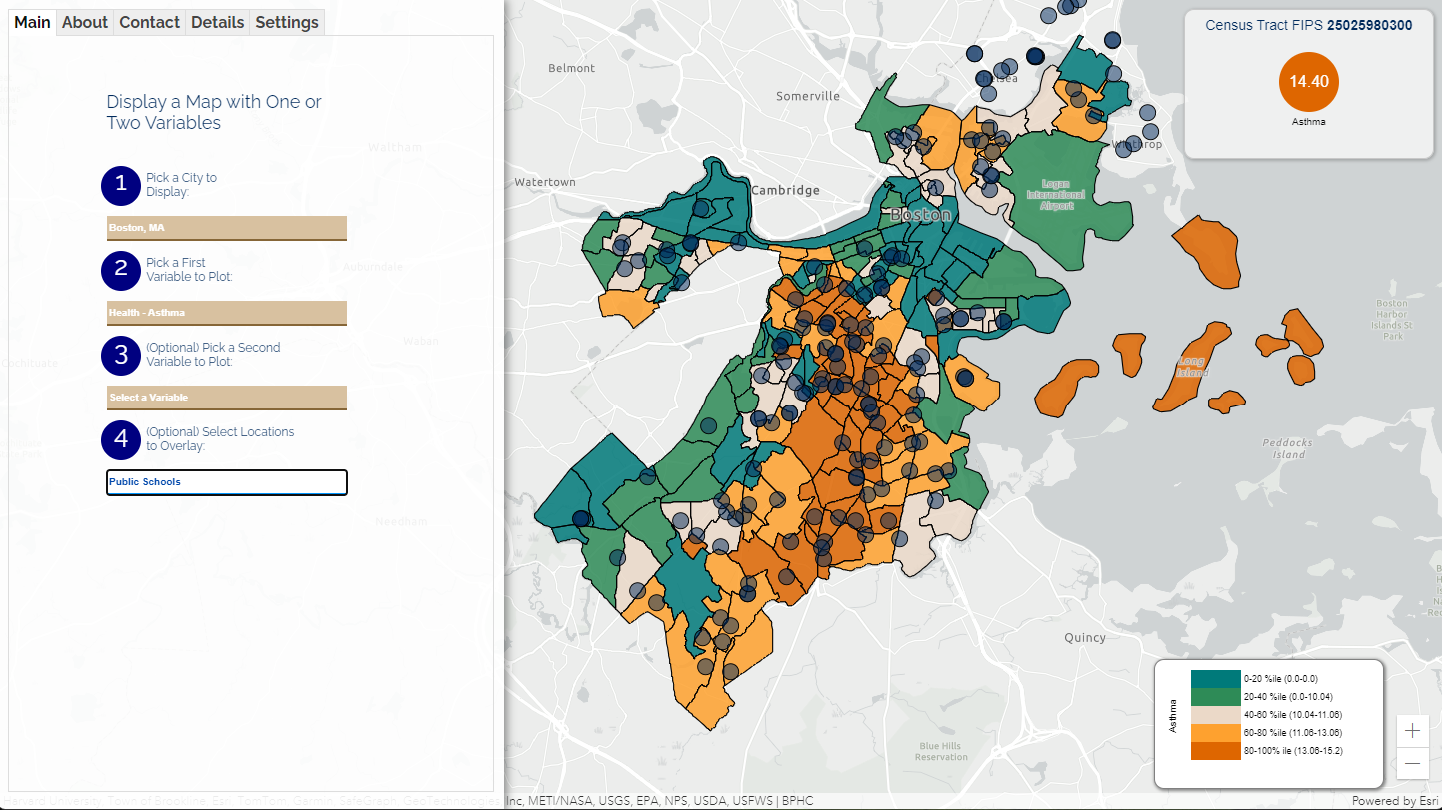
Once the map is displayed, you can click on a census tract to display health and pollution data in the side tab, or click on one of the public school locations to get more details about the school.
Example Use Case: COVID-19 Deaths and Particulate Matter
To explore the relationship between particulate matter and COVID-19 deaths in Boston and display private schools, do the following:
- 1. Pick a city - you can select Boston
- 2. Select the first measure - select particulate matter
- 3. Select the second measure - select COVID-19 deaths (this will display a colored map with two variables, known as a bivariate choropleth)
- 4. Select locations to overlay with asthma - in list 4, click on "Private Schools" to overlay the locations on the map.
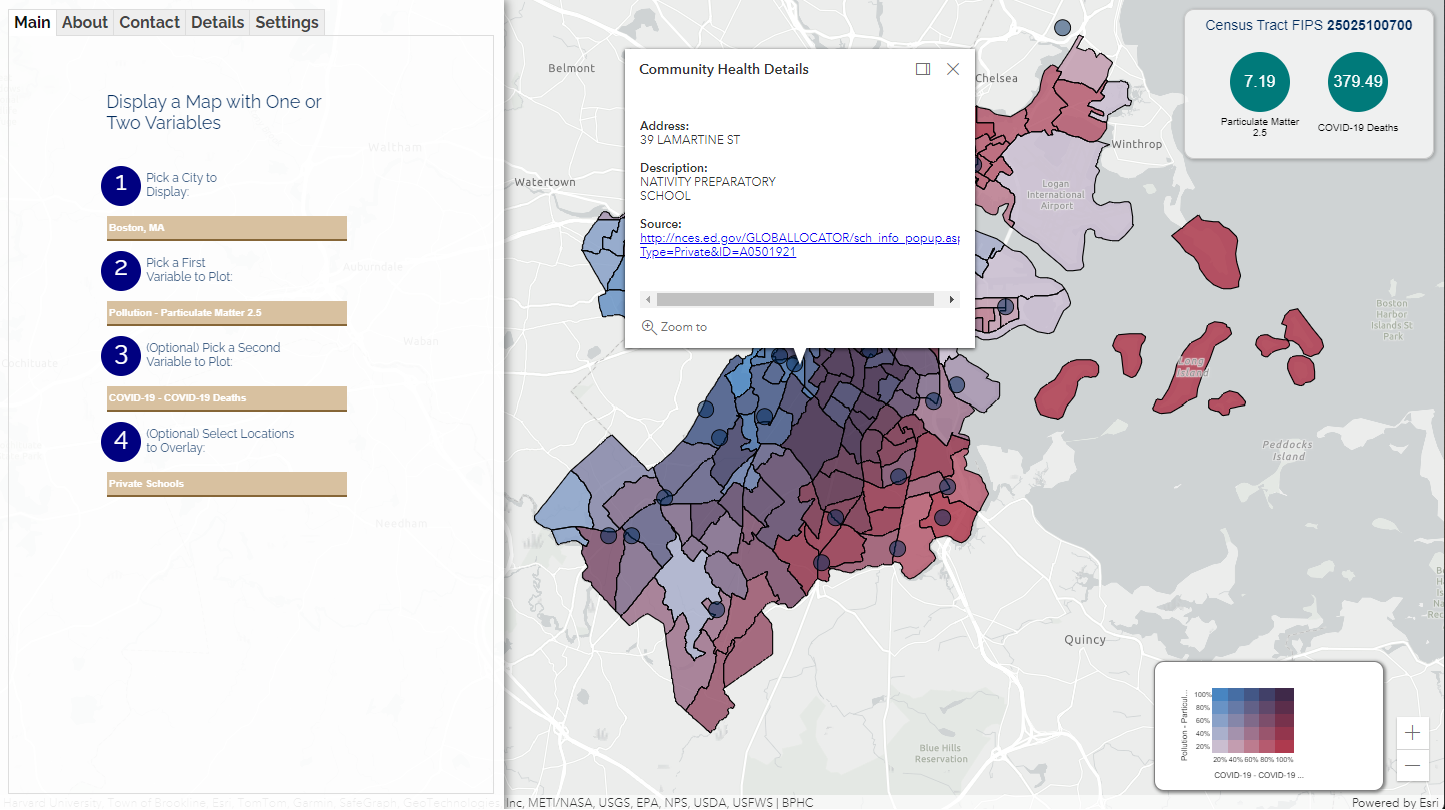
Once the map is displayed, you can click on a census tract to display health and pollution data in the side tab, or click on one of the private school locations to get more details about the school:
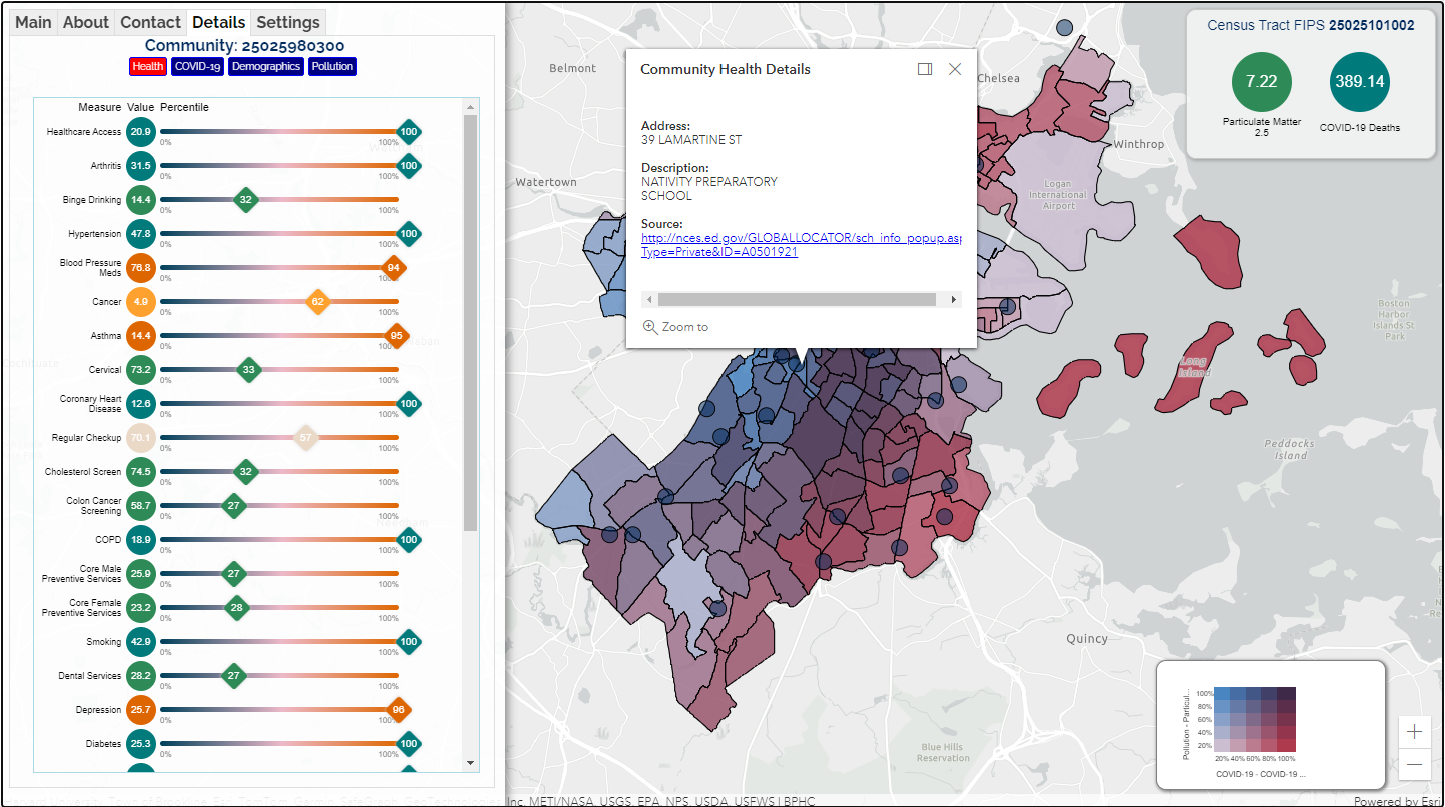
Using two variables (bivariate choropleths), one can explore the different health, demographic, and pollution variables associated with COVID-19 cases and deaths.
Data Sources and Technical Information
Several datasets are incorporated into this dashboard, which can be described as follows:| Measure | Year | Description |
| COVID-19 Cases | 2023 | The cumulative case rate of COVID-19 cases, estimated at the census-tract level. To calculate these rates, COVID-19 case data at the county-level was downloaded from Johns Hopkins University. Then, an Elastic Net regression was performed at the county-level, modelling COVID-19 case rate as a function of chronic diseases, demographic, and pollution measurements at the county level. Those chronic disease, demographic, and pollution measurements were then used as independent variables at the census-tract level to perform small-area estimates of COVID-19 case rates at the census-tract level. |
| COVID-19 Deaths | 2023 | The cumulative case rate of COVID-19 deaths, estimated at the census-tract level. To calculate these rates, COVID-19 case data at the county-level was downloaded from Johns Hopkins University, and then a small-area estimation was performed using Elastic Net regression using the same method described for COVID-19 cases. |
| Life Expectancy | 2023 | Small-area estimates of life expectancy as provided by the USALEEP project (by the CDC). |
| Percent Minority | 2021 | US Census-derived percentage minority (everyone who is not considered to belong to the "White" racial category) rates for each census-tract (provided in the EPA EJSCREEN database). |
| Percent Low Income | 2021 | US Census-derived percentage low income rates for each census-tract (provided in the EPA EJSCREEN database). |
| Percent Less than Highschool | 2021 | US Census-derived percentage of a census-tract population without highschool education (provided in the EPA EJSCREEN database). |
| Percent Linguistic Isolation | 2021 | US Census-derived percentage of a census-tract population who have limited English proficiency or do not speak English (provided in the EPA EJSCREEN database). |
| Percent Under Age 5 | 2021 | US Census-derived percentage of a census-tract population under the age 5 (provided in the EPA EJSCREEN database). |
| Percent Over Age 64 | 2021 | US Census-derived percentage of a census-tract population over age 64 (provided in the EPA EJSCREEN database). |
| Percent Unemployed | 2021 | US Census-derived percentage of a census-tract population that is unemployed (provided in the EPA EJSCREEN database). |
| Lead Paint | 2021 | A normalized measure of lead paint exposure in a census-tract (from the EPA EJSCREEN database). |
| Diesel Particulate Matter | 2021 | A normalized measure of diesel particulate matter exposure in a census-tract (from the EPA EJSCREEN database). |
| Air Cancer Risk | 2021 | A risk score of a population's average risk of getting cancer due to air pollution exposure (from the EPA EJSCREEN database). |
| Air Respiratory Risk | 2021 | A risk score of a population's average risk of getting respiratory illness due to air pollution exposure (from the EPA EJSCREEN database). |
| Traffic Proximity | 2021 | A normalized measure of traffic proximity (and therefore exposures to air pollution, noise, and other issues) in a census-tract (from the EPA EJSCREEN database). |
| Wastewater Discharge | 2021 | A normalized measure of average exposure to wastewater discharge in a census-tract (from the EPA EJSCREEN database). |
| Superfund Proximity | 2021 | A normalized measure of average proximity to superfund environmental remediation sites in a census-tract (from the EPA EJSCREEN database). |
| RMP Facility Proximity | 2021 | A normalized measure of average proximity to RMP facilities (Risk Management Plan) in a census-tract (from the EPA EJSCREEN database). |
| Hazardous Waste Proximity | 2021 | A normalized measure of average hazardous waste proximity in a census-tract (from the EPA EJSCREEN database). |
| Ozone | 2021 | A normalized measure of average ozone rate in a given census-tract (from the EPA EJSCREEN database). |
| Particulate Matter 2.5 | 2021 | A normalized measure of average particulate matter 2.5 rate (thought to be associated with COVID-19 infection risk and chronic diseases) in a given census-tract (from the EPA EJSCREEN database). |
| Underground Storage Tanks | 2021 | A normalized measure of exposure to underground storage tanks in a given census-tract (from the EPA EJSCREEN database). |
| Healthcare Access | 2023 | The percentage of a population in a census-tract with access to healthcare (ie. the percentage of a census-tract population with health insurance) from the CDC PLACES database. |
| Arthritis | 2023 | The percentage of a population with arthritis (from the CDC PLACES database). |
| Binge Drinking | 2023 | The percentage of a population who have experienced binge drinking (from the CDC PLACES database). |
| Hypertension | 2023 | The percentage of a population with hypertension (high blood pressure) from the CDC PLACES database. |
| Blood Pressure Meds | 2023 | The percentage of a population taking Blood Pressure medications (antihypertensives) from the CDC PLACES database. |
| Cancer | 2023 | The percentage of a population with a diagnosis of cancer (from the CDC PLACES database). |
| Asthma | 2023 | The percentage of a population with a diagnosis of asthma (from the CDC PLACES database). |
| Cervical Cancer Screening | 2023 | The percentage of a population who have had cervical cancer screening (from the CDC PLACES database). |
| Coronary Heart Disease | 2023 | The percentage of a population who have a diagnosis of Coronary Heart Disease (from the CDC PLACES database). |
| Regular Checkup | 2023 | The percentage of a population who have regular health checkups (from the CDC PLACES database). |
| Cholesterol Screening | 2023 | The percentage of a population who have been screened for high cholesterol (from the CDC PLACES database). |
| Colon Cancer Screening | 2023 | The percentage of the male population who have have been screened for colon cancer (from the CDC PLACES database). |
| COPD | 2023 | The percentage of the population who were diagnosed with COPD (from the CDC PLACES database). |
| Core Male Preventive Services | 2023 | The percentage of the male population who have had Core Male Preventive Services in the past year (from the CDC PLACES database). |
| Core Female Preventive Services | 2023 | The percentage of the female population who have had Core Female Preventive Services in the past year (from the CDC PLACES database). |
| Smoking | 2023 | The percentage of the population who smoke (from the CDC PLACES database). |
| Dental Services | 2023 | The percentage of the population who have used dental services (from the CDC PLACES database). |
| Depression | 2023 | The percentage of the population with a diagnosis of depression (from the CDC PLACES database). |
| Diabetes | 2023 | The percentage of the population with a diagnosis of diabetes (from the CDC PLACES database). |
| General Health | 2023 | The percentage of the population in good general health (from the CDC PLACES database). |
| High Cholesterol | 2023 | The percentage of the population with high cholesterol (from the CDC PLACES database). |
| Renal Health | 2023 | The percentage of the population with renal disease (from the CDC PLACES database). |
| Limited Physical Activity | 2023 | The percentage of the population with limited physical activity (from the CDC PLACES database). |
| Mammogram | 2023 | The percentage of the female population with regular mammograms (from the CDC PLACES database). |
| Mental Health | 2023 | The percentage of the population with good mental health (from the CDC PLACES database). |
| Obesity | 2023 | The percentage of the population who are obese (from the CDC PLACES database). |
| Physical Health | 2023 | The percentage of the population with good physical health (from the CDC PLACES database). |
| Limited Sleep | 2023 | The percentage of the population with limited sleep (from the CDC PLACES database). |
| Stroke | 2023 | The percentage of the population with a diagnosis of stroke (from the CDC PLACES database). |
| Tooth Loss | 2023 | The percentage of the population with tooth loss (from the CDC PLACES database). |
Glossary
- Bivariate choropleth - a colored map in which regions are colored according to two variable scales.
- CDC - Center for Disease Control.
- COPD - Congestive Obstructive Pulmonary Disease.
- EPA - Environmental Protection Agency.
- FIPS - Federal Information Processing Standards - a standardized identifier for census-tracts (12 digits long), counties (5-digits), states (2-digits), and other regions.
- Hypertension - high blood pressure.
- Univariate choropleth - a colored map in which regions are colored according to a single variable scale.
References
- Boston Public Health Commission - https://www.boston.gov/government/cabinets/boston-public-health-commission
- CDC PLACES - https://www.cdc.gov/places/index.html
- EPA EJSCREEN - https://www.epa.gov/ejscreen
- USALEEP - https://www.cdc.gov/nchs/nvss/usaleep/usaleep.html
- US Census - https://www.census.gov/
